Visualizing Progressions for Education and Game Design
A visualization system to compare two differnt progressions from the education game Refraction.
This project is an interactive visualization of progressions from games. It allows for two progressions from the same game to be compared.
This is useful because it lets game designers ask important questions about their game without having to playtest and re-design in a labor-intensive loop. While playtesting is critical and irreplaceable, certain insights can be gleaned by visualizing progressions in a tool like ours. For instance:- How does the concept ordering compare across two progressions?
- How does the complexity change over the progression?
- How much of the "design space" is covered by one progression, but not the other? i.e., does one progression neglect some concepts or combinations thereof?
Materials
How to Run
The program is web-based, but requires a python web server backend to do the MDS computation. The primary python packages it requires are:
- Flask
- numpy
- scipy
- matplotlib
- scikit-learn
pip install -r req.txt
The entry point is in src/main.py.
It will launch a webserver on
localhost:5000
So, for example, on a recent ubuntu distro, the program can be setup and run with:
          sudo apt-get install python-virtualenv
          virtualenv venv/
          source venv/bin/activate
          pip install -r req.txt
          cd src/
          ./main.py
Then, in a browser, open http://localhost:5000/
Several datasets are included in src/data/. The main page has links to a few interesting example comparisons. The last link ("pick datasets manually") lets the user select datasets from a dropdown (automatically generated by scanning the data folder)
Example Use Case
- Load up the "Refraction (original vs. generated)" dataset.
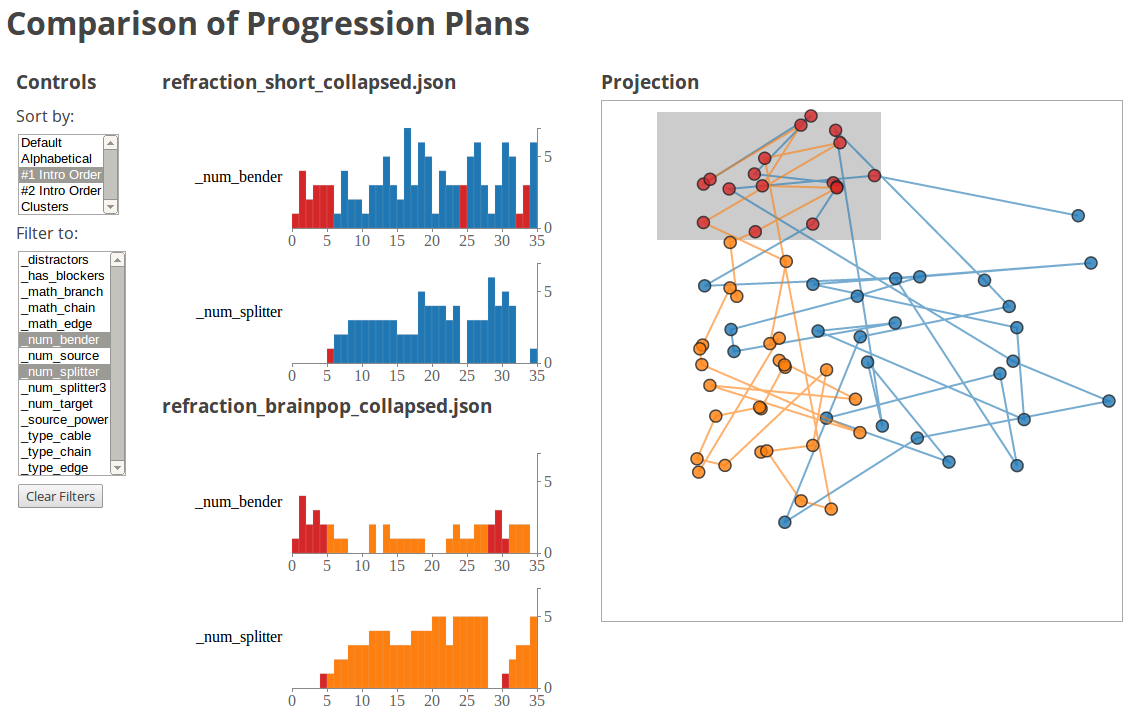
- Under the "Controls" on the left-hand side, in the drop-down list called "Sort By:", select the "#1 Intro Order". This sorts the concepts in the two grids according to order of appearance in the first progression.
- Under the "Controls" on the left-hand side, in the drop-down list called "Filter To:", select the "num_splitter". The grid views are replaced with the details of the "num_splitter" concept across the two progressions. Multiple concepts can be (de)selected by holding down the "Control" (or "Command" on Mac) key while clicking them.
- Clear the selection(s) by clicking the "Clear Filters" button on the bottom left. This hides the bar charts and shows the grid views.