Final Project Template
Acknowledgement: Example abstract, image and videos are from Lyra.
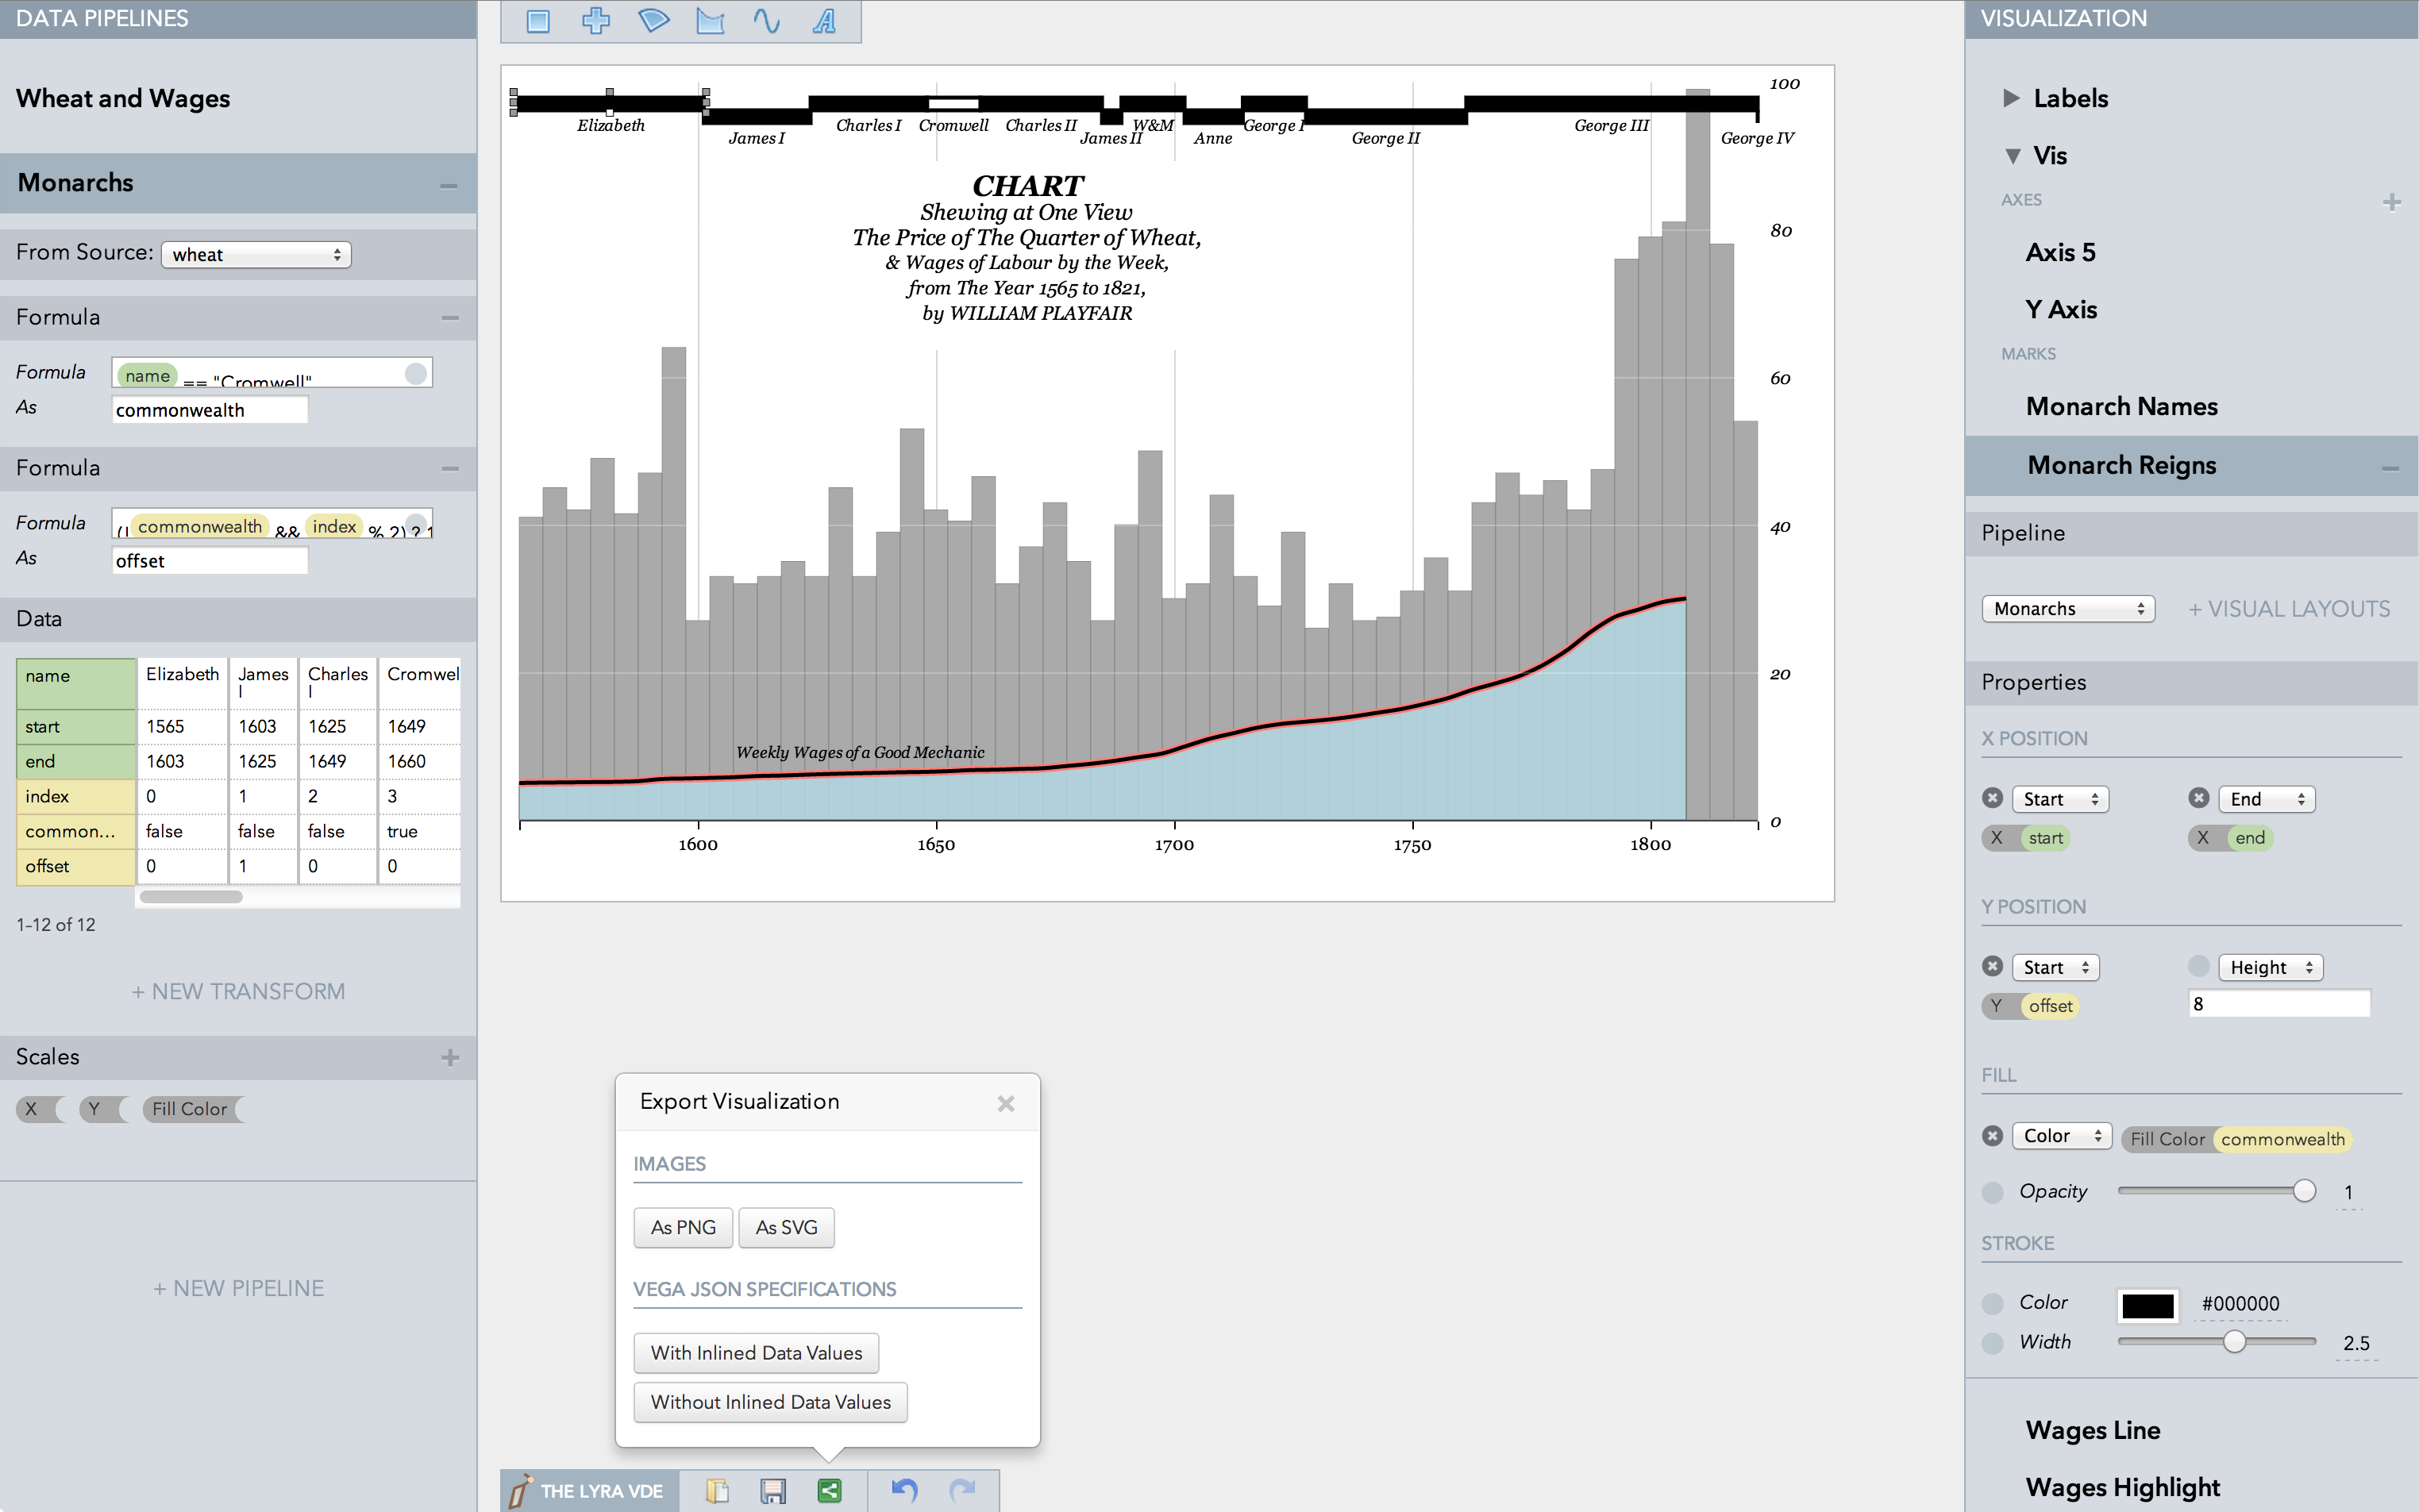
Lyra is an interactive environment that enables custom visualization design without writing any code. Graphical “marks” can be bound to data fields using property drop zones; dynamically positioned using connectors; and directly moved, rotated, and resized using handles. Lyra also provides a data pipeline interface for iterative visual specification of data transformations and layout algorithms. Lyra is more expressive than interactive systems like Tableau, allowing designers to create custom visualizations comparable to hand-coded visualizations built with D3 or Processing. These visualizations can then be easily published and reused on the Web.
Software
Try it online here. (Put detailed running instructions here if you don't have an online version available. If your software requires some learning before using, you might want to put a short tutorial here.