Voronoi Treemaps in D3
Abstract
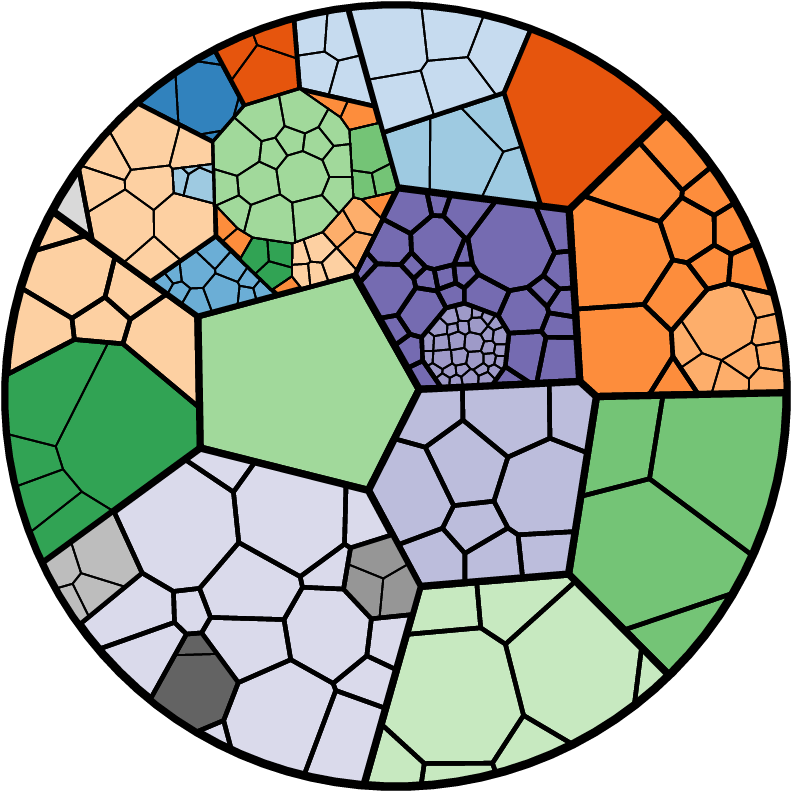
Voronoi treemaps are an alternative to traditional rectangular treemaps for visualizing hierarchical data. Like rectangular treemaps, Voronoi treemaps represent hierarchical data by dividing the canvas region into cells for each node at the top of the hierarchy, and then further dividing each of these cells for the children of those nodes. The organic shapes created by the Voronoi treemap can be easier to distinguish sibling nodes from nodes in other branches of the hierarchy. Voronoi treemaps can also be fit to non-rectangular canvases, and are often more aesthetically pleasing.
Software
We implemented the fastest known version in javascript and gave it a D3 API so you can incorporate it into your favorite D3 application. Use d3.layout.voronoitreemap() the same way you would any other d3.layout for hierarchical data. If your dataset is deeper than three or four levels it is recommended you set a maximum depth as the Voronoi treemap computations can get pretty heavy.
A demo of our software is available here. The page source for this demo also demonstrates the use of our software.