QuiViz: Visualizing Physical Query Execution in a Relational Big Data Management System
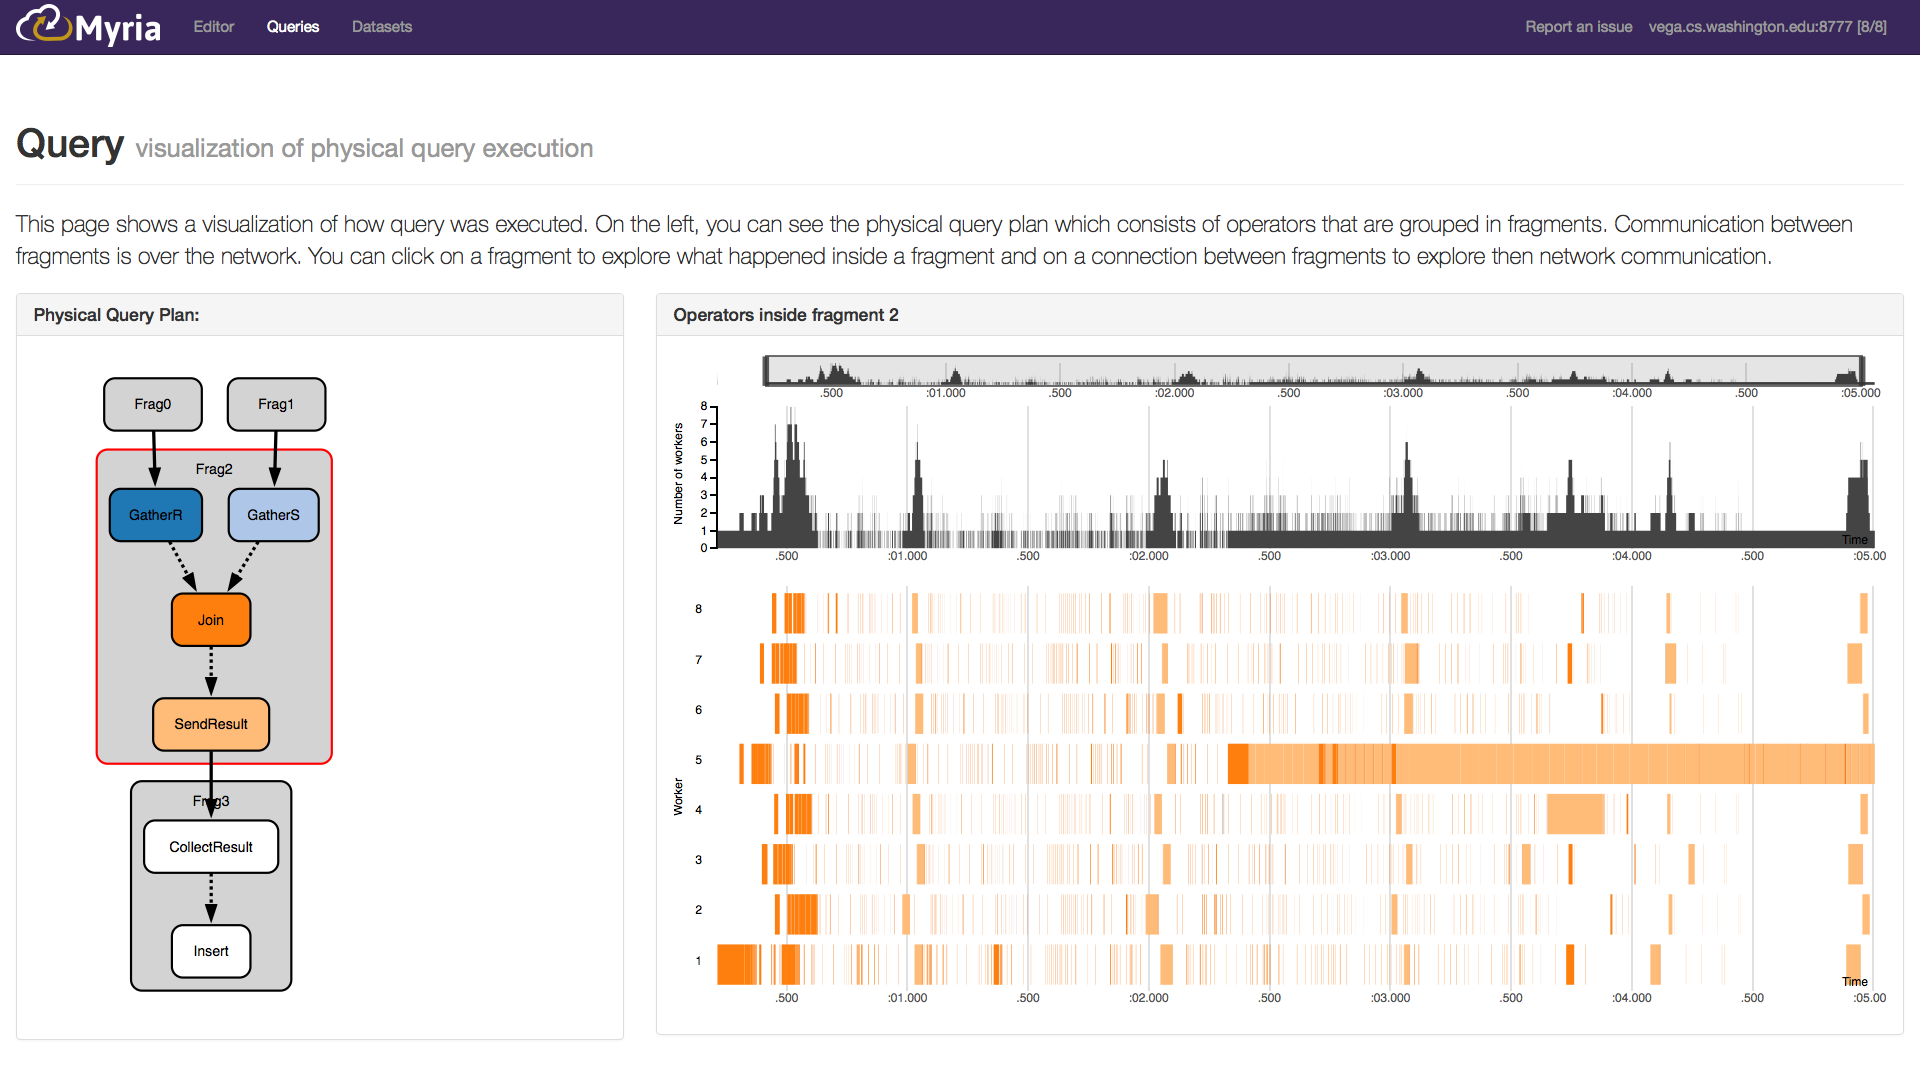
QuiViz is a visualization tool that helps database developers explore
and understand query execution and data movement in a distributed database
management system. QuiViz provides quick insight into common problems
such as data skew or performance bottleneck by leveraging visualization
techniques to present: (1) data flow between query operators and between
workers, (2) query execution and operator dependencies, (3) cluster
utilization, (4) network utilization.
In particular, QuiViz is built to inspect query execution in Myria, a distributed
big data management system currently being developed in the
UW CSE database group. Myria aims towards building a distributed database
platform to provide \emph{big data management and analytics as a service} primarily
for scientific applications. The proposed visualizations can easily be applied to
other DDBMS as well (e.g. Spark, Hadoop).
Software
Try QuiViz online here. This is running on Google App Engine and uses a small Myria cluster with 8 workers that is running at vega.cs.washington.edu:8777.
Team Responsibilities
Our team of four is led by Dominik, who started working on a query visualization framework for Myria last quarter. The responsibilities for each of the group members are listed below:
- Umar Javed: visualizing network data flow between workers
- Thierry Moreau: visualizing query plan
- Dominik Moritz: architect, data collection, back end and rest interfaces, interaction between visualizations, performance optimizations for visualizations, bits and pieces in the different visualizations
- Adriana Szerkes: visualizing query fragment execution, poster
Materials
Code
Since it is necessary to run Myria and Myria web to be able to see the visualization, we could not put the code into the repository. Adding the code as submodules was not possible because GitHub could not build the page then. Please see our code at https://github.com/uwescience/myria and https://github.com/uwescience/myria-web. There are running instructions for Myria and Myria web. However, the setup is very complex at the moment.